Welcome back to our weekly dev log. Following last week’s introduction to our propulsion goals, it’s time to look at the hardware that makes precision possible. When dealing with the high-energy environment of a jet engine, you can’t rely on “feel”—you need high-fidelity data to ensure the turbine is hitting its performance targets without exceeding its thermal limits.
Today, we’re doing a tech deep dive into our custom thrust stand. Specifically, we are looking at the technical competence required to measure the critical relationship between thrust and air density.
The Hardware Stack: Engineering for Extreme Forces
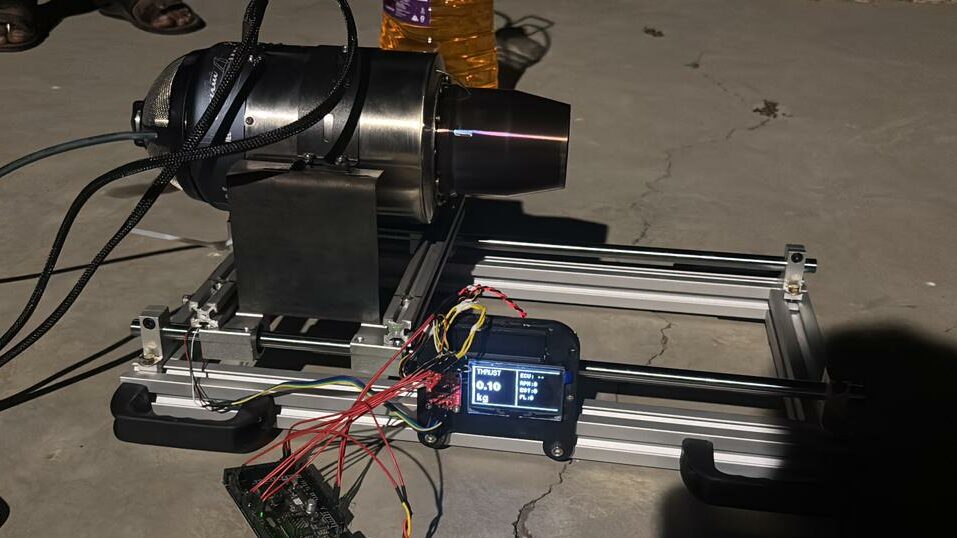
Measuring a jet engine is a different beast than measuring an electric prop. We have to contend with high-frequency acoustic vibrations, massive heat soak, and significant axial force. Our stand is designed to benchmark engines producing up to 50kg of thrust.
- The Bar-Type Load Cell: At the core of the stand is a heavy-duty bar-type load cell. As the turbine generates thrust, it creates a minute bending moment in the aluminum bar. This deformation is captured by a strain gauge bridge and converted into a digital force reading.
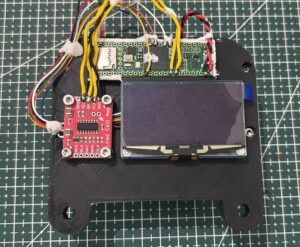
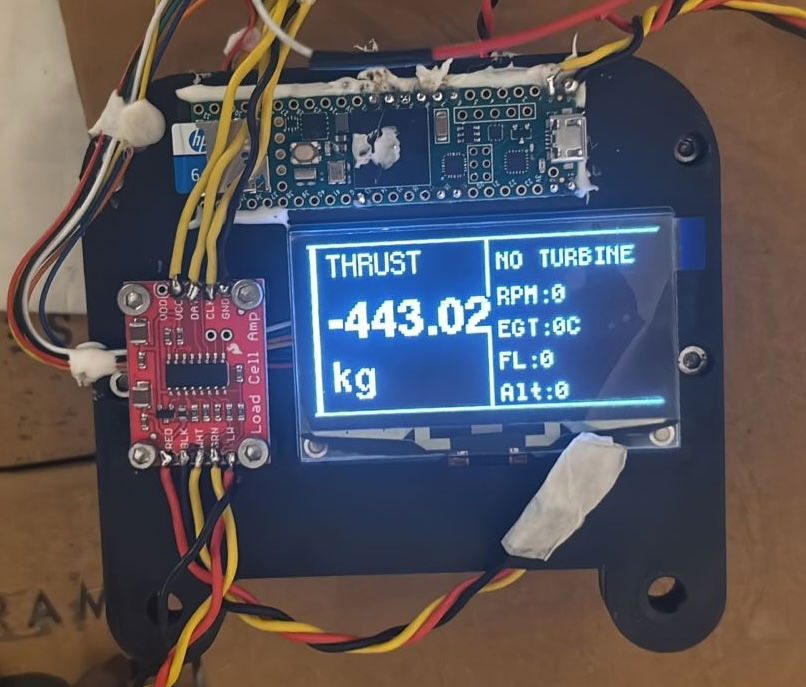
- ECU Integration: This isn’t a standalone scale. Our hardware interfaces directly with the engine’s Electronic Control Unit (ECU). This allows us to time-sync our thrust data with internal engine telemetry, including:
- RPM: Real-time rotational speed of the turbine.
- EGT (Exhaust Gas Temperature): Critical for ensuring we don’t melt the turbine blades in thin air.
- Fuel Flow: Measured in mL/min to calculate specific fuel consumption.
- Environmental Sensing: Because air density is our primary variable, the stand includes a shielded probe for ambient temperature and barometric pressure .
The Physics: Why Air Density is King
In a jet engine, air density ($\rho$) dictates how much oxygen is available for combustion and how much mass flow can be accelerated through the nozzle. The performance is governed by the Mass Flow Rate:
= . A .
Where:
- is the mass flow rate.
- is the air density.
- A is the intake area.
- is the velocity.
When air density drops (due to high altitude or high temperatures), the engine sucks in less “mass” per second. To maintain the same thrust, the ECU might increase RPM, which in turn raises the EGT. Without a thrust stand that “talks” to the ECU, you might see the thrust drop but not realize the engine is working twice as hard—and running dangerously hot—to produce it.
Technical Focus: Standardizing the Data
To ensure our engineering is sound, we don’t just record the raw thrust. We use our sensors to convert “Measured Thrust” into “Corrected Thrust” (). This allows us to compare tests taken on different days or at different locations as if they happened under Standard Day conditions ( at sea level).
By syncing the Fuel Flow and Thrust data, we calculate the Thrust Specific Fuel Consumption (TSFC). This tells us exactly how many kilograms of fuel we burn to produce one Newton of thrust—a metric that changes significantly as the air thins out.
We calculate the temperature correction factor () and the pressure correction factor ():
By applying these ratios, we can verify if a drop in performance is due to a mechanical issue in the turbine or simply the physics of the air density on that specific day.
Why This Matters for Our Project
Building a stand with this level of technical integration allows us to:
- Map Efficiency: Determine the “sweet spot” of fuel flow vs. thrust at different density altitudes.
- Monitor Engine Health: If the EGT is climbing higher than usual for a specific thrust level, we know the engine is struggling with air intake.
- Predict Range: Using accurate TSFC data to calculate how long our craft can stay airborne at various altitudes.
What’s Next?
Now that we have the “scale” built and the ECU talking to our logger, it’s time to burn some Jet-A. Next week, we’ll share the data from our first 50kg-limit hot fire and show you how the EGT behaves as we ramp up to full throttle.